What Is Standard Deviation?
Standard deviation (SD) is a number that tells you how spread out a set of values is around their average. A small standard deviation means the values cluster tightly around the mean; a large one means they are widely scattered. It is the most widely used measure of spread in statistics, and it shows up in grading, finance, quality control, and research — anywhere the average alone does not tell the whole story.
Example: two classes both average 75 on a test. In Class A, most scores fall between 70 and 80. In Class B, scores range from 40 to 100. Same mean, very different classes — and standard deviation is the number that captures that difference.
Population vs. Sample Standard Deviation
There are two standard deviation formulas, and choosing the wrong one is the most common mistake:
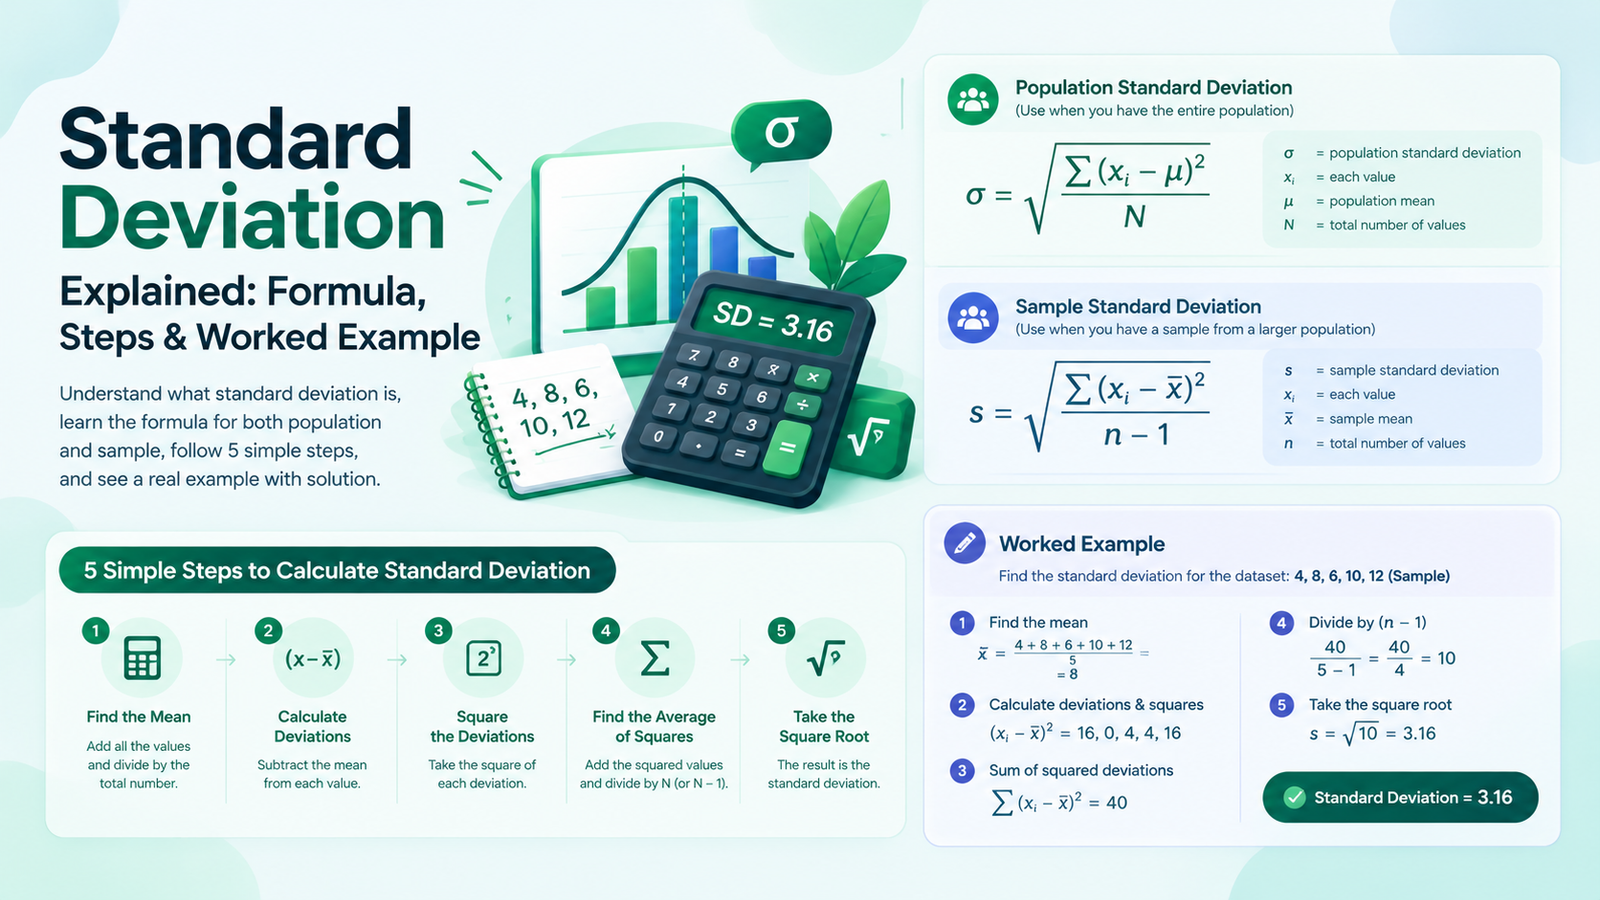
- Population SD (σ): use it when your data covers every member of the group — all 30 students in a class, every sale in a full month. Divide by N (the number of values).
- Sample SD (s): use it when your data is a sample from a larger group — 200 voters polled out of millions, 50 units pulled off a production line. Divide by n − 1 (Bessel’s correction), because a sample tends to underestimate the true spread.
Rule of thumb: if you are unsure, use the sample formula — that is the statistics convention, and it is what most calculators and spreadsheet functions default to.
Population: σ = √[ Σ(xᵢ − μ)² / N ] | Sample: s = √[ Σ(xᵢ − x̄)² / (n − 1) ]
How to Calculate Standard Deviation in 5 Steps
Step 1 — Find the mean
Add all the values together and divide by how many there are.
Step 2 — Subtract the mean from each value
These differences are called deviations. Some will be negative — that is expected.
Step 3 — Square each deviation
Squaring removes the negative signs and punishes large deviations more than small ones.
Step 4 — Average the squared deviations
This average is the variance. Divide by N for a population, or by n − 1 for a sample.
Step 5 — Take the square root
The square root of the variance is the standard deviation — back in your original units.
Worked Example: Quiz Scores 4, 8, 6, 10, 12
Take five quiz scores: 4, 8, 6, 10, 12. Follow the five steps:
Step 1 — Mean: (4 + 8 + 6 + 10 + 12) ÷ 5 = 40 ÷ 5 = 8
Step 2 — Deviations (each value minus 8): −4, 0, −2, 2, 4
Step 3 — Squared deviations: 16, 0, 4, 4, 16 → sum = 40
Step 4 — Variance: population = 40 ÷ 5 = 8; sample = 40 ÷ 4 = 10
Step 5 — Standard deviation: population σ = √8 ≈ 2.83; sample s = √10 ≈ 3.16
Interpretation: quiz scores typically deviate from the average of 8 by about 3.16 points (sample SD). Notice the sample SD is a little larger than the population SD — that is Bessel’s correction at work, compensating for the smaller divisor.
Second Example: The Classic Dataset 2, 4, 4, 4, 5, 5, 7, 9
This dataset appears in textbooks everywhere, and it is a useful check on your method:
Mean: (2 + 4 + 4 + 4 + 5 + 5 + 7 + 9) ÷ 8 = 40 ÷ 8 = 5
Deviations: −3, −1, −1, −1, 0, 0, 2, 4
Squared deviations: 9, 1, 1, 1, 0, 0, 4, 16 → sum = 32
Variance: population = 32 ÷ 8 = 4; sample = 32 ÷ 7 ≈ 4.57
Standard deviation: population σ = √4 = 2; sample s ≈ 2.14
If your calculator gives you 2 for this dataset, it computed the population SD; if it gives 2.14, it computed the sample SD. Both are correct — they answer different questions.
How to Interpret Standard Deviation
- SD near 0: nearly all values are identical (for example, every student scored 8 out of 10).
- Small SD relative to the mean: consistent, predictable data. A mean of 100 with an SD of 2 is very tight.
- Large SD relative to the mean: wildly varying data, and the average alone is misleading.
- The empirical rule (for roughly bell-shaped data): about 68% of values fall within 1 SD of the mean, about 95% within 2 SD, and about 99.7% within 3 SD.
- Comparing datasets in different units: an SD of 5 kg and an SD of 5 cm cannot be compared directly. Use the coefficient of variation instead: CV = SD ÷ mean. A CV of 0.10 means the spread is 10% of the mean, whatever the units.
Standard Deviation vs. Variance
Variance is step 4 of the calculation — the average of the squared deviations. Its problem is its units: if your data is in points, variance is in “squared points,” which nobody can picture. Standard deviation fixes that by taking the square root, returning the spread to the original units. Report the standard deviation when you want a number people can interpret; keep variance for the intermediate math and for formulas that need it.
How to Calculate Standard Deviation in Excel, Google Sheets, and Python
Excel: =STDEV.S(range) for sample SD, =STDEV.P(range) for population SD. (The older =STDEV() is the sample version.)
Google Sheets: the same functions work — =STDEV(range) for sample, =STDEVP(range) for population.
Python: statistics.stdev(data) gives the sample SD and statistics.pstdev(data) gives the population SD. For the quiz-score example, statistics.stdev([4, 8, 6, 10, 12]) returns 3.1623.
Handheld calculators: on a TI-84 Plus, enter the data in a list and run 1-Var Stats — Sx is the sample SD and σx is the population SD. On a Casio fx-991EX, use the Statistics mode and read s (sample) versus σ (population) the same way. The labels differ by brand, but the distinction is always sample versus population.
Standard Deviation in Real Life
Finance: investors use SD as a measure of volatility. Two funds can both average 8% annual returns, but the one with an SD of 5% is far steadier than one with an SD of 15% — the second fund’s returns swing much wider around that average, which means higher risk.
Quality control: a factory filling 500 ml bottles wants a tiny SD. If the mean fill is 500 ml with an SD of 2 ml, almost every bottle is close to target; an SD of 15 ml means many bottles are noticeably under- or over-filled.
Grading and testing: a test with a mean of 70 and an SD of 5 tells a teacher the class clustered together; the same mean with an SD of 20 means the test separated strong and weak students sharply — or that some students were lost entirely.
Z-Scores: Putting a Value in Context
A z-score tells you how many standard deviations a value sits from the mean: z = (x − mean) ÷ SD. Using the quiz-score example (mean 8, precise sample SD 3.162): a score of 12 has z = (12 − 8) ÷ 3.162 ≈ 1.26, meaning it sits 1.26 standard deviations above average. A score of 4 has z = (4 − 8) ÷ 3.162 ≈ −1.26, the same distance below. Z-scores let you compare values from different datasets on one scale.
Standard Deviation vs. Standard Error: Do Not Confuse Them
Standard deviation describes the spread of your data. Standard error (SE) describes the precision of your mean as an estimate: SE = SD ÷ √n. With the quiz scores (sample SD 3.16, n = 5), the standard error of the mean is 3.16 ÷ √5 ≈ 1.41. A small SE means the sample mean is a reliable estimate of the population mean; a large SE means it is shaky. Report SD when describing your data, SE when describing the uncertainty of your average.
Population or Sample? A Quick Decision Guide
| Your situation | Use |
|---|---|
| Every student in one class | Population SD |
| A survey of 200 voters | Sample SD |
| All daily sales for one full month | Population SD |
| 50 units sampled from a production run | Sample SD |
| Your own complete dataset, nothing beyond it | Population SD |
| Data you will generalize to a bigger group | Sample SD |
What Standard Deviation Does Not Tell You
SD summarizes spread in a single number, so it hides shape. A dataset with two clumps (half the class scoring near 40, half near 90) can have the same SD as a dataset spread evenly — but the stories are completely different. Outliers also inflate SD: one extreme value can dominate the squared deviations. When your data is skewed or has outliers, look at the distribution itself (a histogram or the median and quartiles) alongside the SD.
Common Mistakes to Avoid
- Using the population formula on sample data — the number-one error; it understates the spread.
- Forgetting the square root — variance is not the standard deviation.
- Comparing SDs across different units or scales — use the coefficient of variation instead.
- Assuming a “good” SD exists — there is no universal target. In manufacturing, smaller is better (consistency); in investing, SD measures risk, and the right level depends on risk tolerance. Always interpret SD relative to the mean and the context.
Frequently Asked Questions
What is the difference between variance and standard deviation?
Variance is the average of squared deviations, measured in squared units. Standard deviation is the square root of variance, back in the original units — which is why SD is the number people actually report and interpret.
When should I divide by n − 1 instead of N?
Divide by n − 1 whenever your data is a sample of a larger population. Only divide by N when you have data for every single member of the group you are describing.
Can standard deviation be negative?
No. It is a square root of a sum of squares, so it is always zero or positive. Zero means every value is identical.
What is a good standard deviation?
There is no universal good value — it depends on context. In manufacturing, smaller is better; in investing, SD measures risk and the right level depends on your risk tolerance. Always interpret SD relative to the mean.
How is standard deviation used in grading?
Teachers use it to see score spread: a small SD means the class performed uniformly, while a large SD flags a wide gap between top and struggling students. Curved grading often assigns grades by SD bands around the mean.
What is the standard deviation of 2, 4, 4, 4, 5, 5, 7, 9?
The population standard deviation is 2 and the sample standard deviation is about 2.14. The mean is 5, the squared deviations sum to 32, and the two answers differ only in whether you divide by 8 (population) or 7 (sample).
Try it: use our free standard deviation calculator — paste your data and get population SD, sample SD, variance, and mean instantly, with no sign-up.